
Completed-trade diagnostics
Review expectancy, costs, R-capture, and performance segments from imported history.

Upload your trades and EdgeTrace shows where money is being lost, where you're making money, and what to look at next.
01 / Import
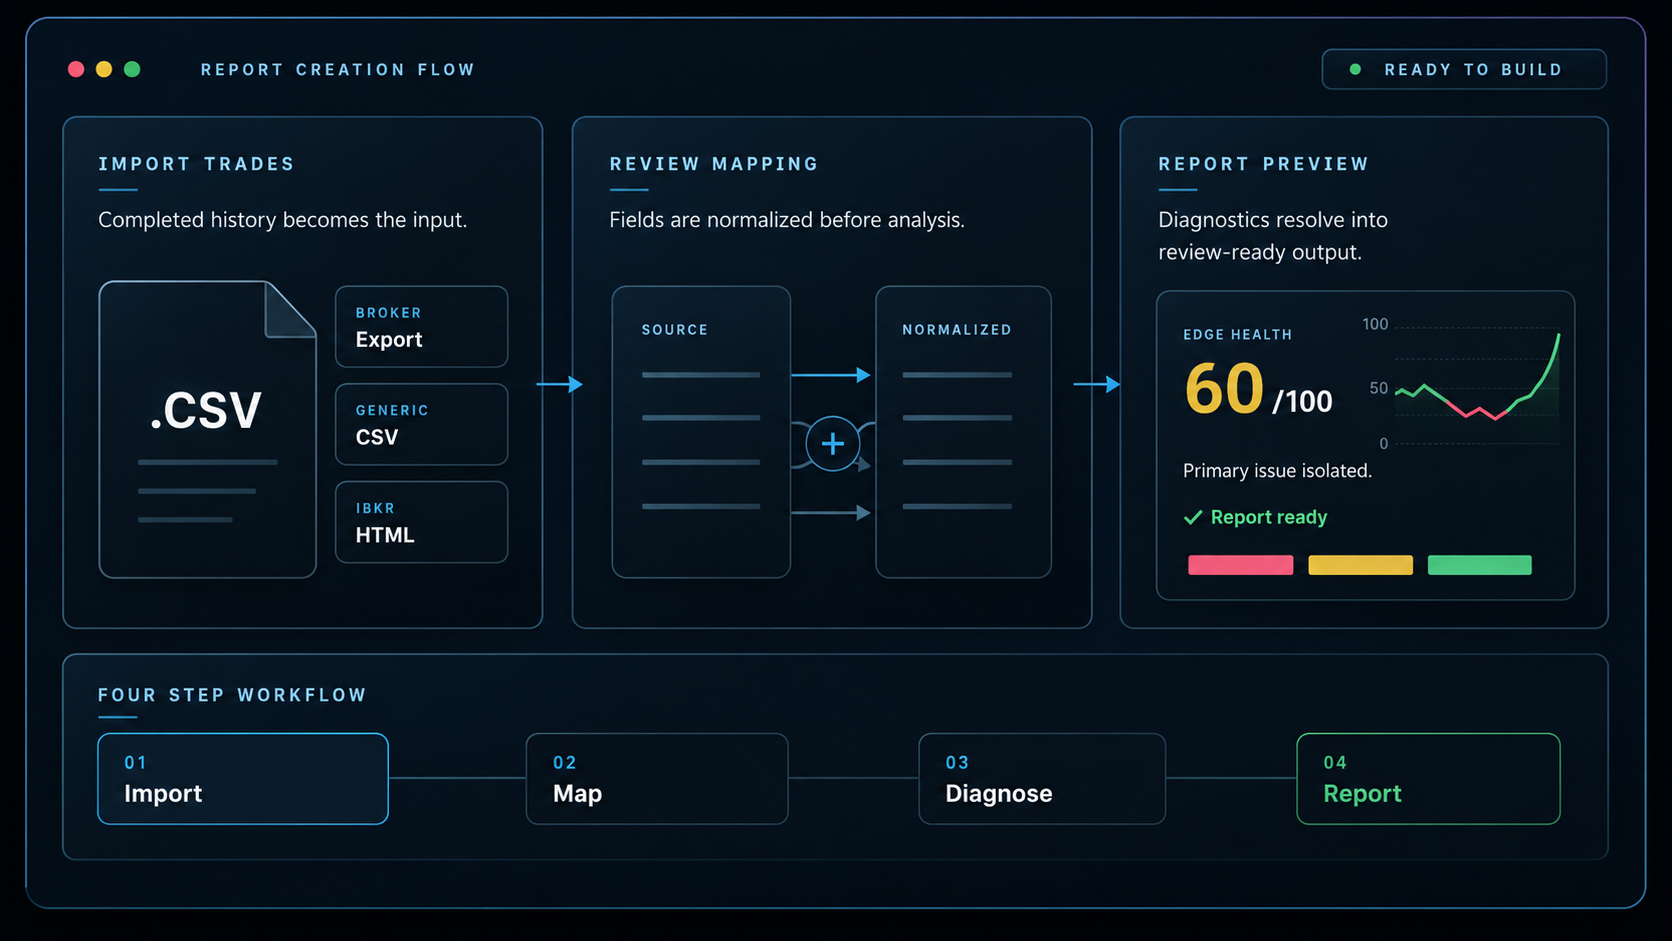
Upload completed trade history from a broker export or a generic CSV. EdgeTrace reviews the mapping, normalizes the file, and turns messy trade rows into report-ready data.
02 / Diagnose
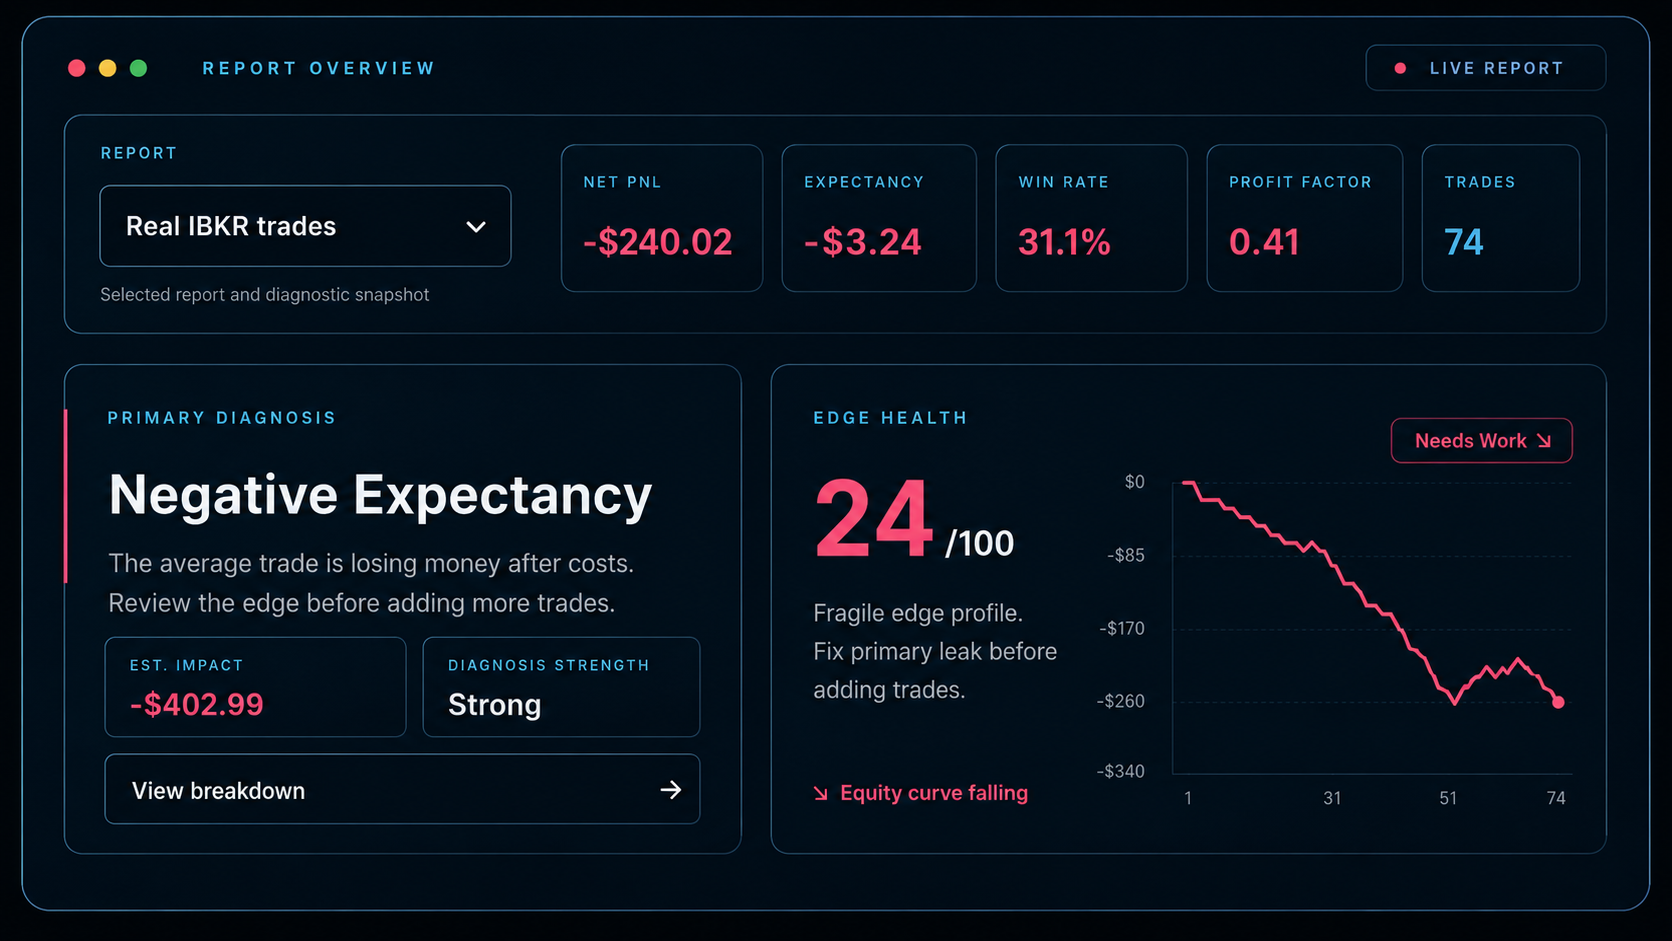
The report turns the import into a quick read on health, expectancy, cost drag, R-capture, and the primary issue most likely to improve the next upload.
03 / Pro drilldowns
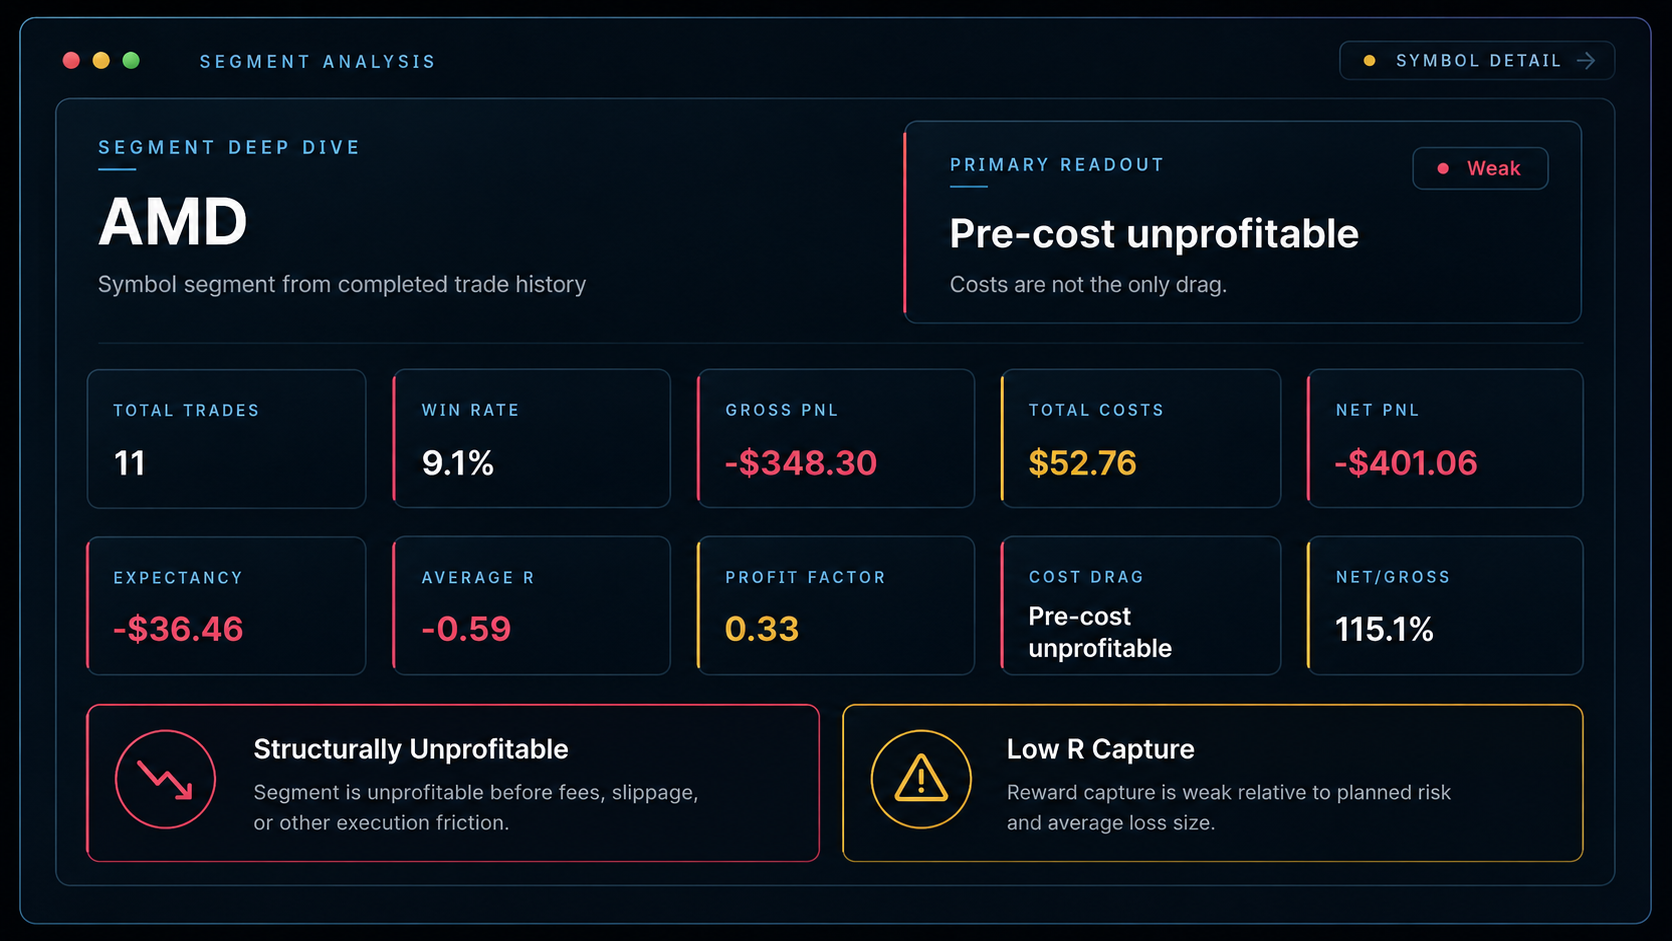
Pro opens the symbol and segment readouts behind the dashboard so you can see whether the leak is coming from costs, weak net PnL, risk capture, or a concentrated pocket of losses.
04 / Actions
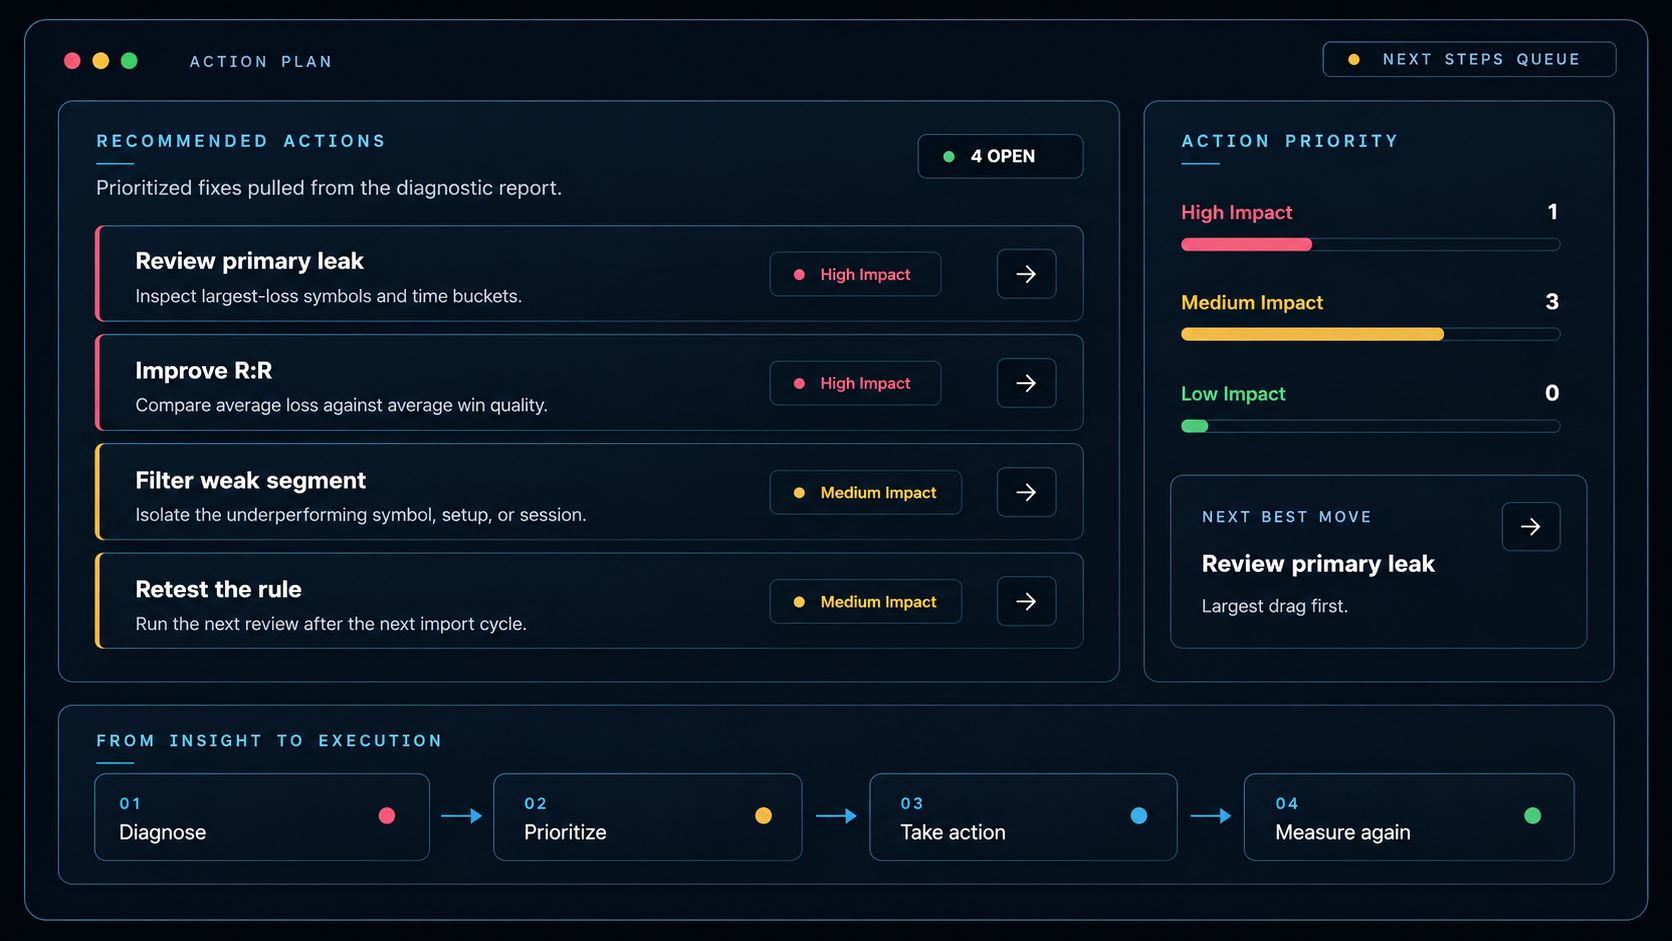
Recommended actions translate the report into a short list of fixes to inspect, retest, or limit before you upload the next batch of completed trades.
05 / Heatmaps
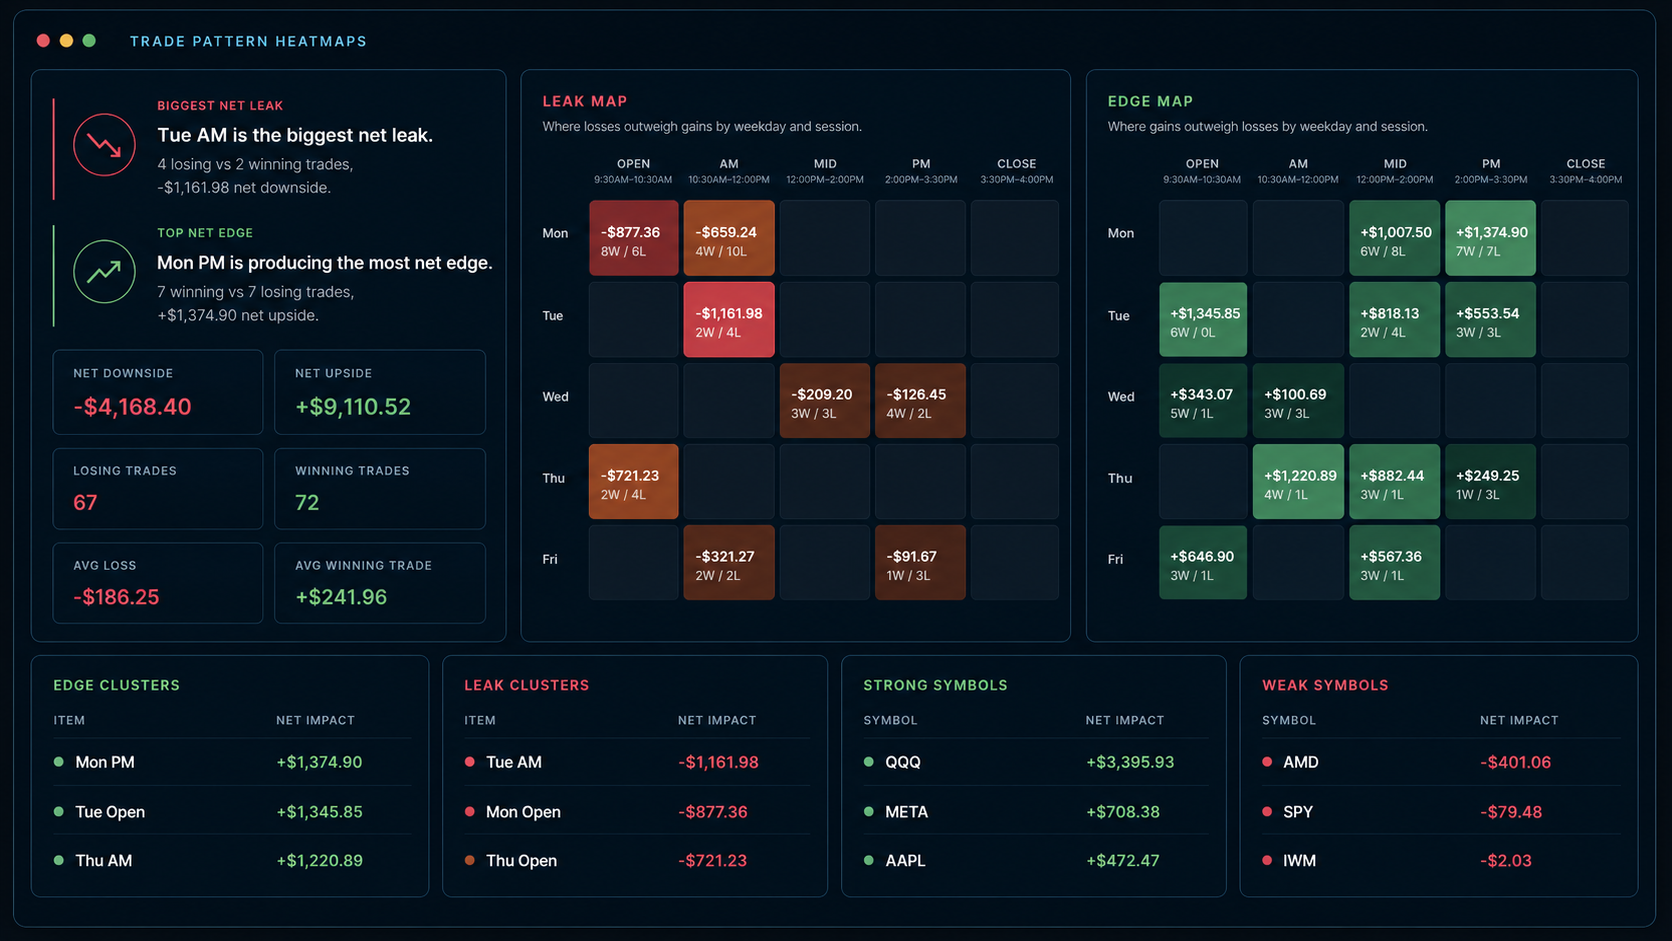
Pro heatmaps separate leak clusters from edge clusters by weekday, session, and symbol, so you can see when money is being lost, where money is being made, and which patterns deserve the next review.
06 / Review Loop
Pro adds the recurring review layer: mistake heatmaps, report-to-report checks, next-upload targets, and review prompts that make EdgeTrace useful after every new report.

Review expectancy, costs, R-capture, and performance segments from imported history.
Encrypted transport and account-scoped access controls.
Key report inputs and diagnostic logic stay visible in the workflow.
Use the core reporting workflow free. Upgrade for drilldowns, heatmaps, and recurring reviews.
Start Now
Import completed trades and see the drivers behind your edge.